Future Now
The IFTF Blog
What if you could make the invisible visible?
![]()
Myriad minutiae in our environments impact our health in countless ways. While we can look at this from many perspectives, one is to identify the risks in our environments, to empower us to avoid, change, organize and agitate around them. This was one of the forecasts in our Health and Health Care 2020 Map, recently released publicly.
This artifact from the future challenges us (from the perspective of a passerby on a Milwaukee sidewalk) to make the invisible visible: to share places at patterns in our lives that stress us out. If we looked at the mash-up online that this poster advertises, we could validate our experiences, find ways to avoid particular places for our own health. Or, we could focus on the experiences of others that surprise us, ad be more considerate and caring as we move through places that stress out our neighbors and fellow citizens. It posits that the ability to quantify and visualize the health impacts of our surroundings will increase our interests and engagement with eco-health issues.
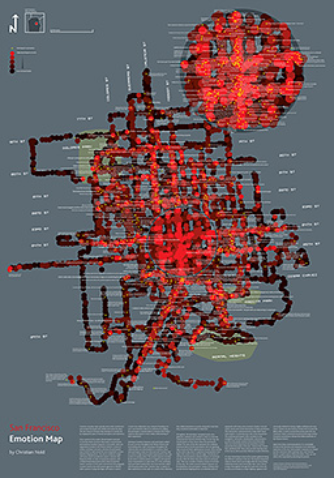
There are numerous real-world assumptions and inspirations at play here. One is that we can locate and quantify health impacts and reactions to our environments in increasingly effortless ways. Artist Christian Nold has created a series of "emotion maps" of cities: equipping volunteers with galvanic skin response sensors that detect emotional arousal through the electrical currents in our skin, and setting them loose to wander their daily routines around their city. This technology can't distinguish positive from negative emotions, but creates maps of emotional intensity. This is the resulting map of San Francisco.

Other efforts reach beyond the world of art and link data from sensors in phones and on health devices to maps, epidemiological databases, and even Facebook accounts. For example, Asthmapolis attaches lightweight GPS devices to the tops of common asthma inhalers to track precisely when and where asthma attacks are triggered. These data are tracked on a smartphone app, then sent to people's doctors and, anonymously, to public health researchers and an aggregate Google map mash-up.
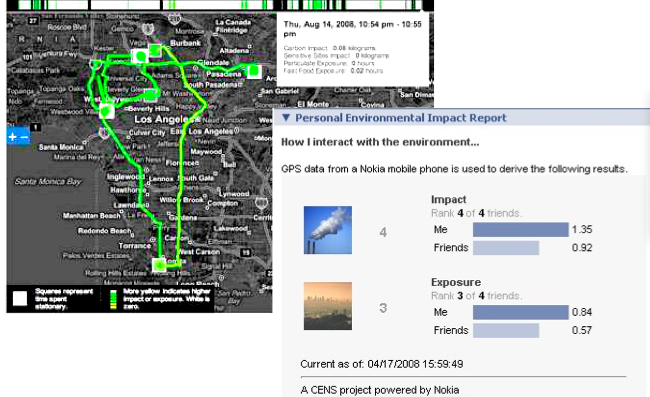
Another project, PEIR, by the Center for Embedded Network Sensing at UC San Diego, links air quality and accelerometer data collected via modified cell phones to analyze not only the environment's impact on their users, but their users' impact on the environment. For instance, the accelerometer readings can conclude whether someone is driving, on a bus, riding a bicycle, or walking—each with their own value for emissions. The resulting "Personal Environmental Impact Report" becomes a resource for researchers of urban environmental health, people trying to understand and change their own behavior, and their social networks as updates are posted to a Facebook widget.

How do you think the different places you move through as you go about your day impact your health, and those around you?
Please add your comments to our Twitter stream: @IFTFHealth.


